.svg)


The Cost Of Volatility – The Path Dependency Of Returns
The path dependency can cause the differences in return and volatility to be stark. In a recent study, we compared the outcomes of a perfectly stable return stream to those of increasing levels of volatility. Read more to see what we discovered.
In a recent analysis, we were comparing the volatility of a return stream on a daily and monthly basis. We all know that if a portfolio goes down by 10%, it must be up more than 10% to get back to even (11.11% to be exact). The path dependency can cause the differences in return and volatility to be stark. In trying to understand where the differences arise, we compared the outcomes of a perfectly stable return stream (0% volatility) to those of increasing levels of volatility.
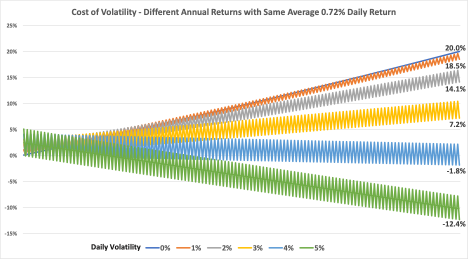
The starting point is an ideal 20% return (blue line) over the course of a year (252 days). The most efficient way to create that return is to generate 0.72% of return per day. Any additional volatility, with the same average of 0.72% return, negatively impacts total return. To show the impact, we simulated six return streams that all had an average of 0.72% daily returns but with varying daily volatilities between 0% and 5% (5% daily volatility is 79% annualized volatility).
For example, with 1% daily volatility (orange line), the daily return flips between 1.071% and -0.926% (average of 0.072%). For 5% volatility (green line), the daily returns flip between 5.066% and -4.922% (also a 0.072% average).
Volatility is a cost that requires a higher average return to get to the same goal. Ex-post (after the goal is reached), if you achieve a 20% return from two assets, you do not care about the path (volatility) that led to the 20% return. On the other hand, ex-ante (before the bet is made), it is harder to get to a 20% return with a 5% vol than a 1% vol.
The compounding impact of volatility is difficult to conceptualize but is important to understand when making investment decisions. This graphic is hopefully a helpful tool to remember how volatility causes us to raise the return bar for an asset.
As a life-long fundamental investor, acknowledging volatility as a risk is a tough pill to swallow. In my career as an analyst, I made forecasts over long periods of time, and I did not care about the path, just the outcome. However, before the bet is made, if I have two assets with the same probability-weighted return of 20% and one has a volatility of 10% and the other 30%, should I be indifferent or should I factor that in to how I size my bet? And if so, how? These are interesting questions that we’ll continue to explore in future posts.