.svg)


Probability of Breaching Price Target (Part 2)
In the second installment of the Probability of Price Target series, we dive into an analysis by Niraj Bhatt of Harbor Spring Capital.
One of my favorite parts of writing the Alpha Theory Blog is having our community of like-minded, probabilistic investors add and improve our thinking. I’ll give a couple of examples. Ryan Roderick reached out to me after reading the blog to discuss how to best determine an investor’s probabilistic skill. Ryan is a former client and board member of CenterBook Partners and has been investing in hedge funds for 25 years. He is a zealot about process in general and, specifically, probabilistic thinking. He looks for attributes and asks questions to see if the investor thinks deterministically or probabilistically because it is his belief that deterministic thinking leads to adverse outcomes in investing.
The second example comes from Niraj Bhatt of Harbor Spring Capital. If you were to ask the Investment Process Team at Alpha Theory, who are our most thoughtful clients, Niraj and Harbor Spring will almost certainly be towards the top. Check out the analysis below by Niraj.
Hi Cameron,
I enjoyed your Feb 15, 2023, Alpha Theory blog post titled “Probability of Breaching Price Target”, thank you for posting that.
In case it is helpful to your Alpha Theory/ CenterBook Partners clients and blog readership, here is an alternative method I’ve used in the past to approach the same problem with identical results that may be useful for visual thinkers:
The price targets and scenario probabilities, when graphed, provide a probability distribution curve made up of adjacent geometric shapes:
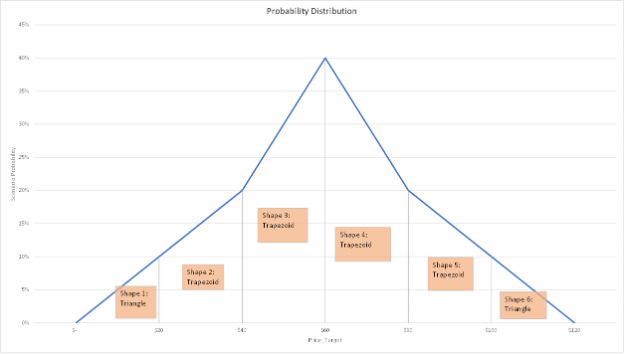
Asking how often a stock should go above our upside target or below our downside target is similar to asking:
“If I was throwing darts at this overall area under the probability curve, what is the likelihood that my dart ends up in the area of Shape 1 or in the area of Shape 6?”
To answer that, we can:
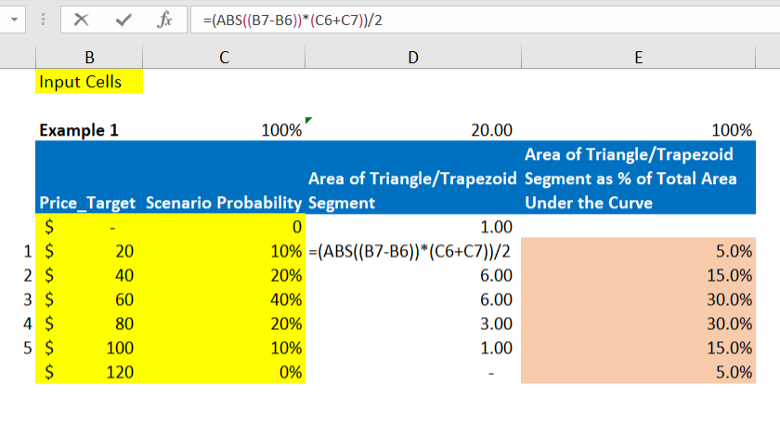
- Calculate the area of all the triangle shapes (half of the base times height) and trapezoid shapes (½ * (base1 + base2) * height)
- Sum all those shape areas to get the total area under the curve
- Determine the area of Shape 1 as a proportion of the total area under the curve – this is the likelihood of ending up in the area of Shape 1 and, equivalently, the probability of how often a stock should go below our downside target
- Determine the area of Shape 6 as a proportion of the total area under the curve – this is the likelihood of ending up in the area of Shape 6 and, equivalently, the probability of how often a stock should go above our upside target
I’ve attached an Excel workbook with the arithmetic and visuals using the three numerical examples you provided; screenshots are below.
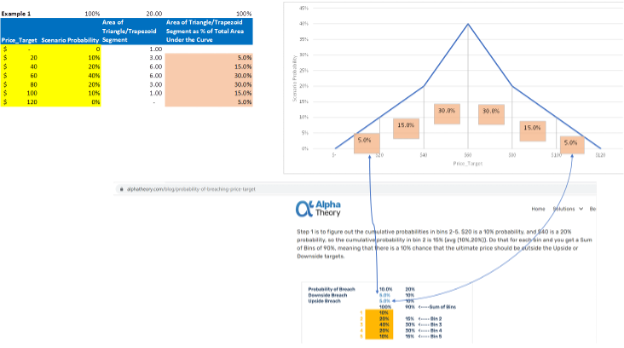
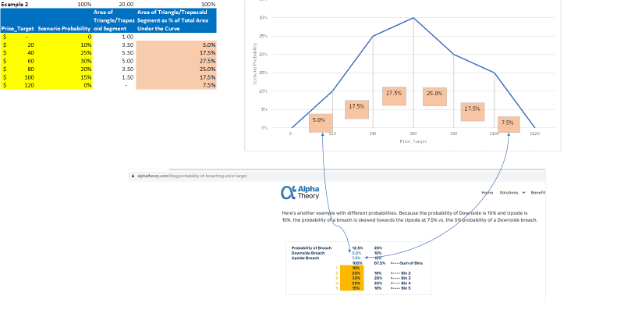
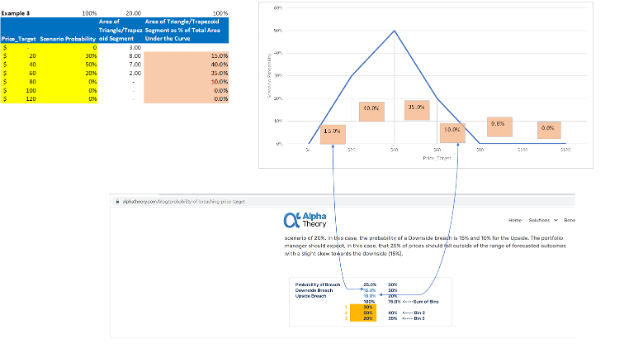
Here is the formula from Excel with the formula expanded:
And this great idea sparked our team to rethink how we calculate the “Probability of Success,” which we use to compare to batting average to measure analyst skill in probability forecasts. You’ll see that analysis in an upcoming blog. This dialog proves that great questions beget great questions. A thoughtful and engaged community leads to breakthroughs. THANK YOU to all that read our blog, make us better, and are the foundation of the probabilistic ecosystem.