.svg)


Volatility is Not Risk…Kind Of
In this article, Cameron Hight discusses that while volatility is often downplayed by fundamental investors as a measure of risk, it can still be a useful tool for adjusting bet sizes based on expected outcomes.
For the fundamentalist, and I count myself as one of them, volatility as a measure of risk is not intuitive. Countless world-class fundamental investors downplay the importance of volatility as a risk factor (Buffett, Munger, Graham, Marks, Klarman, and many more I found in a quick Google search). Their cogent points are two-fold:
- I am buying a stock for $100 because I believe it is worth $200. I don’t really care what path it takes to get there (price volatility).
- How much an investment can lose, not price volatility, is the appropriate measure of risk.
They are absolutely right. Here’s the rub; an investment with a higher expected loss has higher expected volatility and higher historical price volatility can be a decent proxy for potential downside loss.
The examples below show four investments with the same 25% Expected Return but very different potential losses and volatility. *Volatility (StDev) below is calculated over 100 future investments with the proportions of each return determined by the Probabilities1.
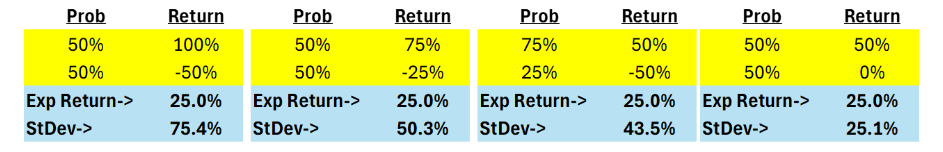
Most investors would not size these bets equivalently with larger bet sizes as we go from left (highest vol) to right (lowest vol). In this case, the volatility of the bet is better than just looking at the loss potential alone making it a handy quantitative way to adjust bet size based on forecasted outcomes that are intuitive to fundamental investors.
Let’s take this a step further and calculate the LT return for making the same bet 100 times in a row and reinvesting the profits. The resultant returns of those 100 bets are the LT ER you see below:
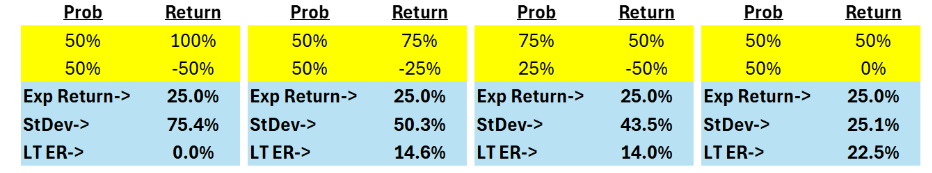
These Long-Term Expected Returns are interesting, but if you’re not betting 100% of your portfolio, Asset #1 with a 0% LT ER can still be valuable to a portfolio because of its positive expected return. But how valuable? The Kelly Criterion can assist us by showing us the appropriate bet size to maximize the long-term Expected Return of our portfolio:
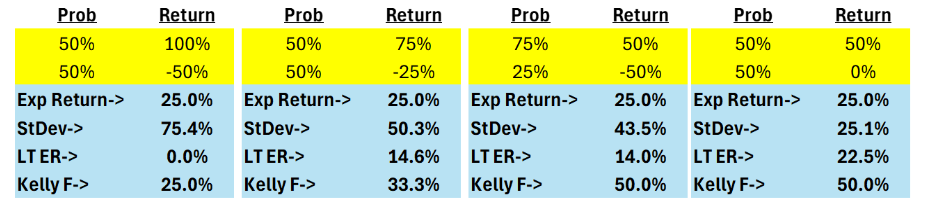
This also seems off as most investors would size Asset #3 and #4 differently, even though their Kelly bet size is equivalent.
Below is an alternative method, Risk Adj ER, that substitutes the downside return with the return required to get back to even. For instance, in Asset #1 below, it replaces -50% with 100% because that is the return required to get back to even if you lose 50%. For Asset #2, -25% is substituted with 33%.
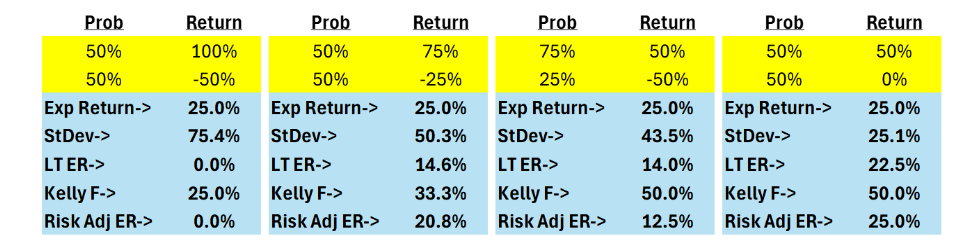
You can see that Asset #2 and #3 are flipped compared to previous examples. This may align better with managers’ instinct as it avoids the large loss scenario but is far from perfect as it suggests 0% exposure to Asset #1.
At Alpha Theory, we allow clients to select their own methodology for incorporating risk. It isn’t limited to one measure but is comprehensive and customized to meet the intuition of the manager. While volatility may not be the most intuitive measure of risk for fundamental investors, it can be valuable for sizing investments. The examples above illustrate that higher expected losses correlate with higher expected volatility, making volatility a useful tool for adjusting bet sizes based on forecasted outcomes.
FUTURE FOLLOW UP: In discussing this with our colleagues at CenterBook Partners, we surfaced an idea for connecting return, risk, and position sizing. Chris White, Head of Portfolio Implementation & Risk at CenterBook, is working on a blog post for August where he will dive into the topic.
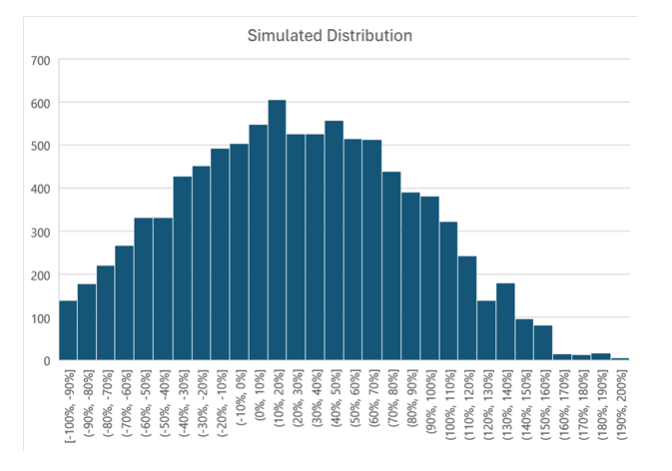
1Calculating standard deviations from a binary distribution is not the same as from a distribution of stock prices. This is an attempt to extract a measure of risk (standard deviation in this case) from the price target and probability data that our clients give us. Below, we’ve simulated an array of prices based on the 50% probability of 100% gain and 50% probability of 50% loss with an expected return of 25% like Example 1. The volatility of this distribution is 60%, 15% less than the 75% standard deviation calculated in the example above.